Application Performance Monitoring (Instana)
It’s challenging to stay current with the dynamic application environments of today. Beyond the manual, compartmentalized, and frequently contextless monitoring provided by classic APM tools, you need capabilities that can monitor the modern application stack, which includes cloud-native apps, containers, and microservices with extremely complex interdependencies.

The next generation of APM intelligence is here with IBM® Instana® Observability, which was created for the cloud. With full enterprise observability, you can quickly, automatically, and contextually view the availability and health of your whole application environment. It gives your teams the ability to speed up CI/CD processes, minimize response times, optimize application performance, and execute diagnostics.
Identify and fix problems more quickly
MTTD (essentially the time it takes to detect an issue) and MTTR (how long it takes to repair it) can be decreased by using real-time observability. Without sampling or blind spots, Instana automates all APM processes, including dependency mapping, monitoring, tracing, root cause analysis, and feedback, allowing your DevOps teams to concentrate on their primary responsibilities.
Enhance the functionality of the program
With contextual data from Instana’s Dynamic Graph, which captures and models interactions between all application components in real time, you can optimize performance proactively. Anyone using Instana’s Context Guide can identify problems and assess their impact.
Intelligent signals that are actionable
Avoid problems with AI and machine learning notifications. Using the Dynamic Graph, Instana offers a comprehensive incident report that correlates all related events. An effect report containing information to facilitate quick incident response is included in the single alert that is produced.


Boost the clientele’s experience
With thorough visuals of each end-user interaction that you can tailor to provide great experiences, you can boost conversion rates.
Simple to use and obtain
Give teams throughout your company access to an intuitive APM platform that benefits all parties involved—not just APM experts. Anyone working in DevOps, SRE, platform engineering, ITOps, or development can get the data they require and the context they desire with Instana.
Features
Full-stack APM
Offers complete distributed tracing—with no sampling—across all components of your application stack, including individual lines of code, databases, and mobile and web apps. enables you to automatically detect, track, and resolve performance issues before they have an adverse effect on the end-user experience.
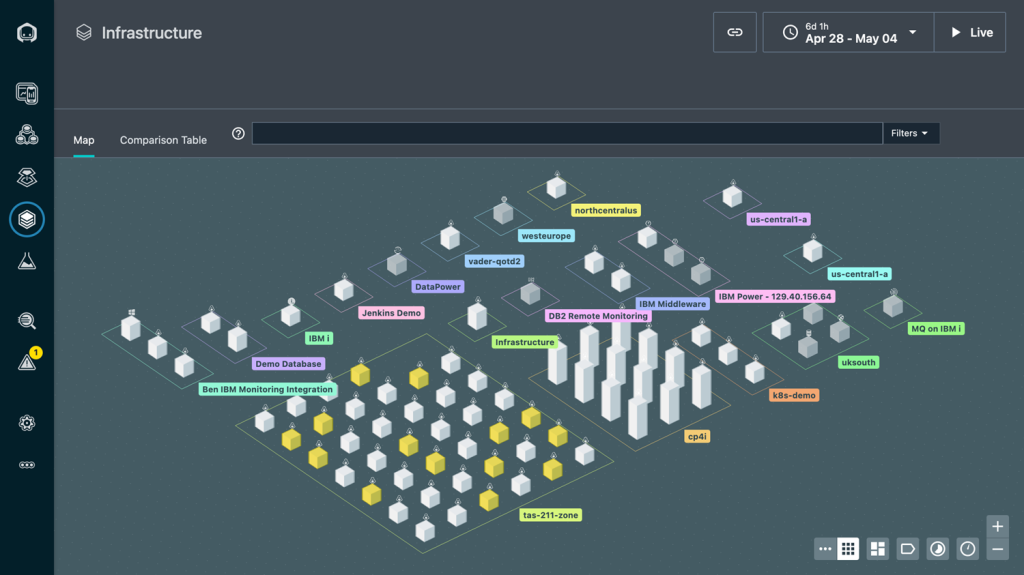
Automatic discovery and monitoring
Aids in identifying every component of an application and offers a graphical depiction of its topology. The Dynamic Graph’s changing dependency chain is defined by continuous discovery, allowing for both spatial and temporal deterministic analysis.
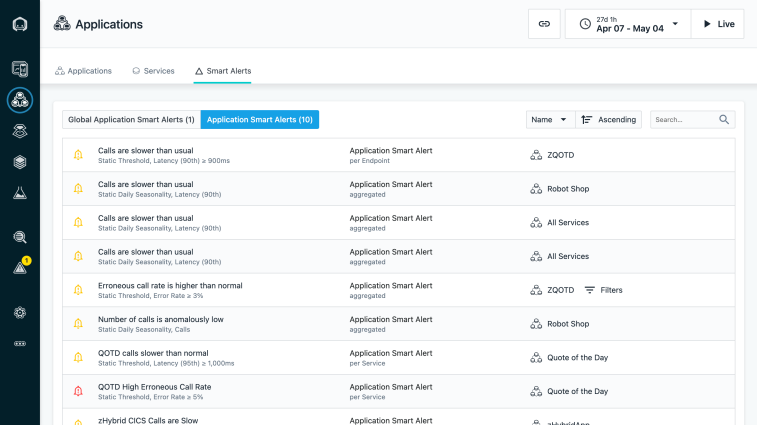
Real-time monitoring and alerting
Notifies IT teams in less than three seconds when application performance issues are found. Monitors application performance in real time with a granularity of one second.
Distributed tracking
Aids in tracking transactions between various application components and offers information on how well one component functions alone and in concert with the others.
Unbounded analytics
Gives IT organizations the tools to evaluate application performance over time, spot trends, and decide on capacity planning and infrastructure optimization. These tools include data analytics and reporting functionalities.
Root cause analysis
Rapidly reduces the amount of time needed to look into the underlying cause of each service impact caused by your apps by automatically detecting changes, problems, and incidents.
For more information, please contact:
Riyadi Wibowo (081284308939)
riyadi@pramatech.id
PT Pramatech Adimitra Solusi
www.pramatech.id